SIEM & XDR
The screen inside Cyber Command where the decision engine's working data becomes visible.
Cyber Command doesn't only act on threats; it also renders what it currently sees. This page covers one screen inside it: a split view with SIEM-style asset risk data on one side and XDR-style attack detection and response data on the other. Below is what each element shows, how it's controlled, and where the numbers come from.
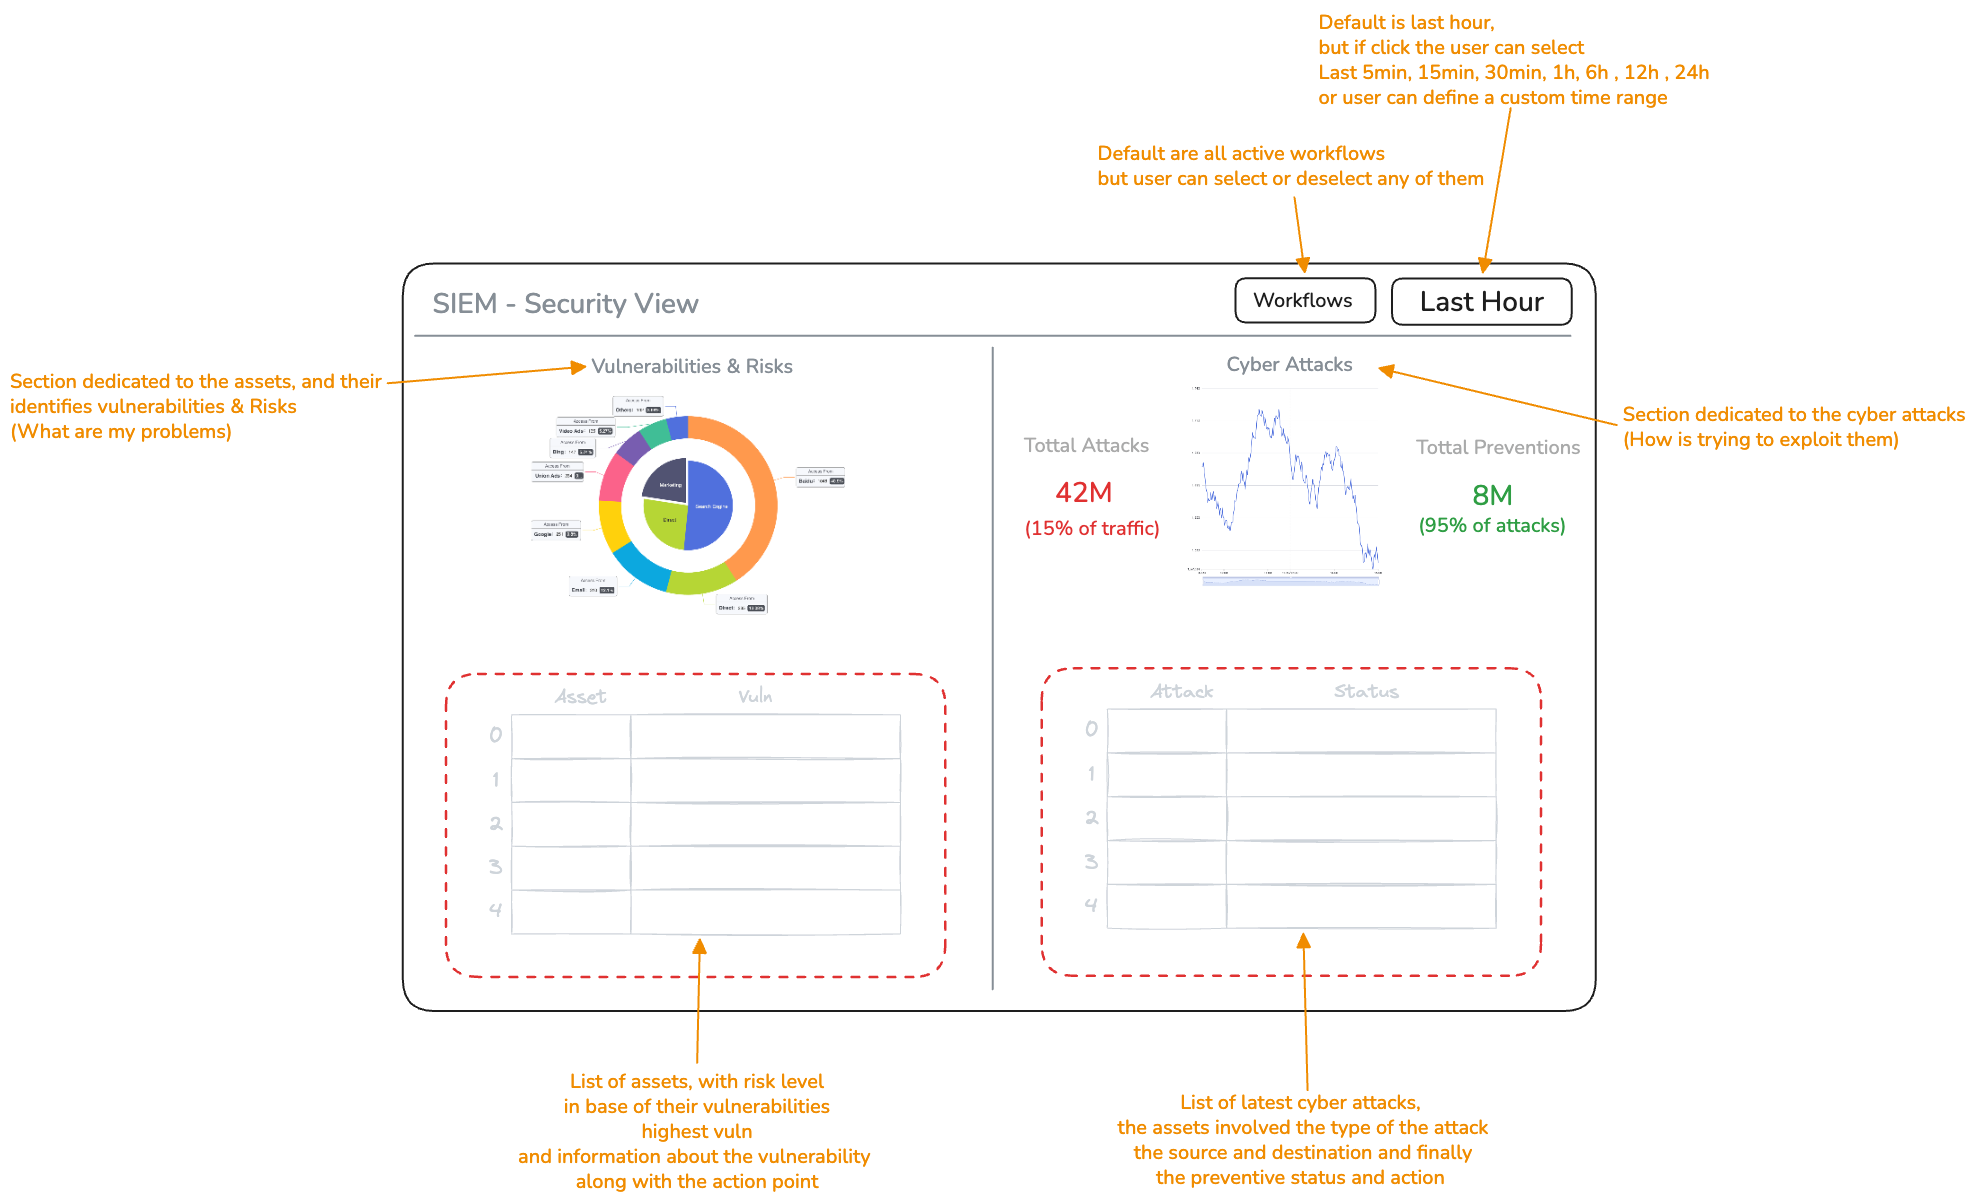
The security view inside Cyber Command, with annotations for the SIEM panel (left) and the XDR panel (right).
One clock
for every widget.
Every counter, chart and table on the screen is scoped to a single time window. There's no separate query per widget; changing the window re-reads the same underlying event data over a different range.
Scoped to
what's relevant.
A workflow is a detection pipeline feeding events into Cyber Command, such as a specific asset group, integration source or rule set. All active workflows are included by default. Deselecting one removes its events from every widget on the screen without touching the time window.
What are
my problems.
The SIEM panel shows the current risk state of the asset inventory, independent of whether an attack is happening right now. It answers one question: given what's known about each asset's vulnerabilities, where is the exposure concentrated.
- Risk distribution chart. A breakdown of the asset base by vulnerability and risk category, so you can see at a glance where the exposure is concentrated.
- Asset / vulnerability table. One row per asset, ranked by risk level. The level comes from the single highest-severity unresolved vulnerability on that asset rather than the count of findings, so an asset with one critical finding ranks above an asset with ten low-severity ones.
- Each row carries the vulnerability detail behind the ranking and a concrete action point: the specific remediation step needed to close it.
| Asset | Vulnerability |
|---|---|
| 0 | Highest-severity finding, ranked |
| 1 | Highest-severity finding, ranked |
| 2 | Highest-severity finding, ranked |
How it's trying
to exploit them.
The XDR panel shows attack activity detected and acted on across the assets in view, for the selected time window. It answers the second question: given the risk state on the left, what is actually being thrown at these assets right now, and what happened to it.
(15% of total traffic)
(95% of attacks)
Figures shown are example values for the default one-hour window. Both counters and the ratio between them recompute for whatever time window and workflow filter is selected.
- Attack volume chart. A time series of attack event counts across the selected window, so spikes show up against the timeline instead of hiding inside a single aggregate number.
- Total attacks / total preventions. Attack count and traffic share on the left, prevented count and prevention rate on the right, both scoped to the same window.
- Attack / status table. One row per attack event: the assets targeted, the attack type, source and destination addresses, and the current status (prevented, active, or under investigation) along with the action taken.
| Attack | Status |
|---|---|
| 0 | Type, source, destination, action taken |
| 1 | Type, source, destination, action taken |
| 2 | Type, source, destination, action taken |
Risk state and attack activity,
reasoned over together.
The two panels are not independent widgets pulled from separate systems. SIEM data, meaning the confirmed vulnerability state of an asset, is a direct input into the Cyber Command decision engine alongside CTI, the asset database and policy rules. An attack against an asset with an open critical vulnerability is scored and handled differently from the identical attack against a patched one, because the decision engine reads both panels' underlying data at decision time rather than the attack event in isolation.
See this view running on your stack
The SIEM and XDR view is part of the Cyber Command interface available to teams in the BondMesh early access programme. Request access to see it populated with your own asset and attack data.